Pack Your Bags – Toronto Hydro and TREB Make Moving a Little Easier New tool offers online services 24 hours a day

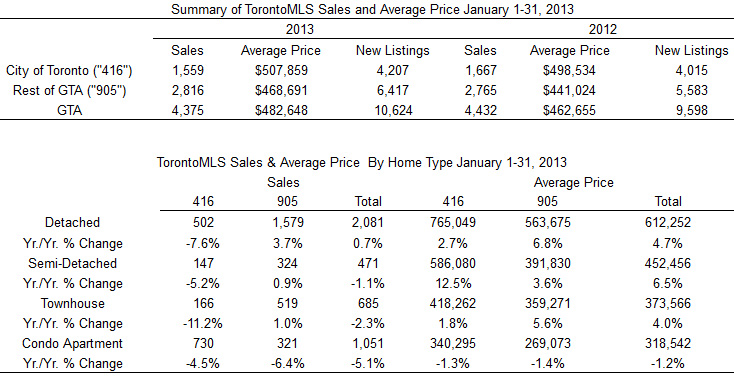
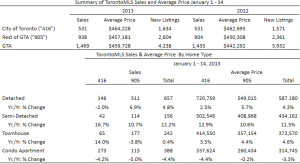
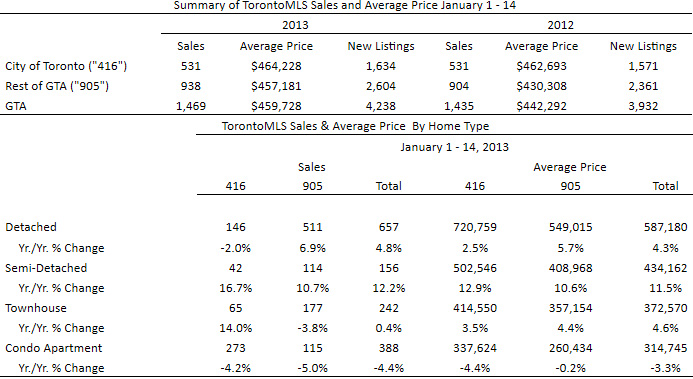
According to the Toronto Real Estate Board (TREB), over 4,375 homes sold within the GTA in the month of January 2013 which means, in the not so distant future, buyers in the city will be closing their deals and moving into their newly purchased homes. In an effort to make the moving process a little easier for the thousands of Torontonians moving each month, Toronto Hydro-Electric System Limited (Toronto Hydro) has launched My TorontoHydroTM – a new online tool to help customers manage their accounts.

My TorontoHydro gives customers fast and secure access to bills, payment history, account details and more. Customers can perform account moves online, 24 hours-a-day from the comfort of their homes.

To better serve new and existing homeowners, Toronto Hydro has teamed up with TREB to create a new Homeowners Kit, which will provide REALTORS® and their clients with information about key programs and services available through Toronto Hydro. From annual coupons and heating and cooling incentives to the fridge and freezer pick-up program, the Homeowners Kit will be a go-to resource for REALTORS® and their clients.

My TorontoHydro online tool is available at www.torontohydro.com and the Homeowners Kit is also available through TorontoMLS® System and TREB’s public website www.TorontoRealEstateBoard.com under “Hot Consumer Topics/Homeownership.” To view a copy of this kit immediately, click here.

In 2011, Toronto Hydro received over 200,000 move requests. The majority of these requests were processed by phone (107,295) or by mail/fax (81,700). With My TorontoHydro, customers can now complete their move in minutes at their leisure – no forms to mail, no phone calls to make.

In addition to performing moves online, customers that register for My TorontoHydro can:

  • Manage accounts wherever they are;
  • Get account details immediately;
  • See bills at a glance;
  • Arrange for ‘set-it-and-forget-it’ payments; and
  • Complete landlord requests for unit consumption records.

QUOTES

“We are excited about the launch of this new tool that will provide customers the choice and convenience they expect.”

“Working with TREB for the launch of My TorontoHydro is a great opportunity for us to reach customers in an entirely new way and we look forward to a long and successful relationship.”

–Chris Tyrrell, Vice President, Customer Care and Chief Conservation Officer, Toronto Hydro.

 “As the primary professional resource for Greater Toronto Area REALTORS®, TREB strives to find new and innovative ways to provide added value to our members.”

“This program with Toronto Hydro will help our REALTORS® continue to provide the cutting-edge service their clients expect.”

– Ann Hannah, TREB President.

 About Toronto Hydro
The principal business of the Corporation and its subsidiaries is the distribution of electricity by Toronto Hydro-Electric System Limited. Toronto Hydro-Electric System owns and operates an electricity distribution system, which delivers electricity to approximately 712,000 customers located in the City of Toronto. It is the largest municipal electricity distribution company in Canada and distributes approximately 18% of the electricity consumed in the Province of Ontario.

Twitter – twitter.com/torontohydro
Facebook – facebook.com/torontohydro
YouTube – youtube.com/torontohydro

About the Toronto Real Estate Board

Greater Toronto REALTORS® are passionate about their work. They adhere to a strict Code of Ethics and share a state-of-the-art Multiple Listing Service. Serving over 36,000 Members in the Greater Toronto Area, the Toronto Real Estate Board is Canada’s largest real estate board. Greater Toronto Area open house listings are available on www.TorontoRealEstateBoard.com

For more information:
Tanya Bruckmueller, Toronto Hydro-Electric System
Tbruckmueller@torontohydro.com

W: 416-542-2621
C: 416-903-0440

Mary Gallagher, Toronto Real Estate Board

maryg@trebnet.com

W: 416-443-8158

GTA Commercial REALTORS Report Commercial Market Figures

Toronto Real Estate Board (TREB) Commercial Division Members reported almost 392,000 square feet of leased industrial, commercial/retail and office space through the TorontoMLS system in January of 2013. This result, for properties sold on a per square foot net basis and for which pricing was disclosed at time of reporting, was down by approximately 15 per cent in comparison to January 2012.

More than 75 per cent of space leased in January involved industrial properties. The amount of leased industrial space was down by close to 25 per cent compared to January 2012. The average lease rate was $5.25 per square foot net. This average rate represented an 11 per cent increase compared to January 2012.

“A slow recovery in the export sector has presented headwinds for the industrial sector. However, the consensus outlook is for continued economic growth in 2013 in Canada. It is felt that improving global economic conditions will bolster exports. With this outlook in mind, it is likely that some industrial firms who put real estate investment on hold will once again become active in the market,” said TREB Commercial Division Chair Cynthia Lai.

There were a combined 40 industrial, commercial/retail and office transactions in January – down from 58 sales in January 2012. The change in the average selling price per square foot was mixed and remained somewhat volatile on a year-over-year basis due to changes in the type, size and location of properties sold in January 2013 versus January 2012.

“The large annual rate of price growth for industrial properties was due to the fact that no property larger than 50,000 square feet sold this past January versus four such transactions in January 2012. Larger properties generally sell at a lower price per square foot,” said Lai.

“In the office market, the overall average selling price for January was up substantially over last year because the geographic breakdown of sales changed. This year there were more office transactions in the City of Toronto. All else being equal, office selling prices in the City of Toronto are higher compared to surrounding regions,” continued Lai.

Untitled-30

GTA REALTORS RELEASE MONTHLY RESALE HOUSING FIGURES

Greater Toronto Area REALTORS® reported 4,375 transactions through the TorontoMLS system in January 2013. This number represented a slight decline compared to 4,432 transactions reported in January 2012.

“The January sales figures represent a good start to 2013. While the number of transactions was down slightly compared to last year, the rate of decline was much less than what was experienced in the second half of 2012. This suggests that some buyers, who put their decision to purchase on hold last year due to stricter mortgage lending guidelines, are once again becoming active in the market,” said Toronto Real Estate Board (TREB) President Ann Hannah.

“It is interesting to note that sales were up for many home types in the GTA regions surrounding the City of Toronto. This is due, at least in part, to the additional upfront land transfer tax in the City of Toronto,” added Ms. Hannah.

The average selling price for January 2013 sales was $482,648 – up by 4.3 per cent compared to $462,655 in January 2012. The MLS® Home Price Index (HPI) Composite Benchmark price was up by 3.8 per cent over the same period.

“There will be enough competition between buyers in the marketplace to prompt continued growth in home prices in 2013. Expect annual average price growth in the three to five per cent range this year,” said Jason Mercer, TREB’s Senior Manager of Market Analysis.

Greater Toronto REALTORS® are passionate about their work. They are governed by a strict Code of Ethics and share a state-of-the-art Multiple Listing Service. Over 36,000 TREB Members serve consumers in the Greater Toronto Area. The Toronto Real Estate Board is Canada’s largest real estate board.

Untitled-29

GTA REALTORS Release Mid-Month Resale Housing Figures

Greater Toronto REALTORS® reported 1,469 sales through the TorontoMLS system during the first two weeks of January 2013. This result represented an increase of 2.4 per cent over the 1,435 transactions reported during the same period in 2012.

“The New Year started off on a positive note with residential sales slightly above last year’s levels,” said Toronto Real Estate Board (TREB) President Ann Hannah. “I am cautiously optimistic about this result. It will be important to watch sales trends closely as we move through the first quarter to see if some of the households who moved to the sidelines as a result of stricter lending guidelines are starting to renew their decision to purchase a home.”

The average selling price during the first 14 days of 2013 was by up by four per cent on a year-over-year basis to $459,728.

“Continuing the trend from 2012, the low-rise segment of the market experienced the strongest price growth as competition between buyers remained quite strong,” said Jason Mercer, TREB’s Senior Manager of Market Analysis. “The average selling price is expected to grow in 2013, but at a slower pace as buyers benefit from more choice.”

Untitled-31

GTA Commercial REALTORS Release Quarterly Commercial Market Figures

Toronto Real Estate Board (TREB) Commercial Division Members reported transactions amounting to almost 3.9 million square feet of leased space through the TorontoMLS system in the Fourth Quarter of 2012. This result was down by 30 per cent compared to the Fourth Quarter of 2011.

Industrial properties accounted for 83 per cent leased space reported in the last three months of 2012. The average industrial lease rate, for properties leased on a per square foot net basis and for which pricing was disclosed, was down slightly from last year, at $4.65 for Q4 2012 versus $4.92 for Q4 2011.

“There were a substantial number of lease transactions in the Fourth Quarter of 2012, but the level of activity remained lower than in the same period in 2011. While the Canadian economy continued to grow in 2012, the pace of growth was somewhat anemic, especially where the export sector was concerned. The high value of the Canadian dollar continued to be a competitive disadvantage to export-focused firms. In addition, economic uncertainty in the United States coupled with global economic headwinds, prompted many exporters to remain on the sidelines in 2012 with regard to real estate investment,” said TREB Commercial Division Chair Cynthia Lai.

There were 214 commercial property sales reported through the TorontoMLS system in the Fourth Quarter of 2012 – down from 300 sales in the Fourth Quarter of 2011. Sales were down for all property types on a year-over-year basis. The number of industrial sales was closest to last year’s level – down by 17 per cent to 97 transactions. Commercial/retail and office transactions were down by 28 and 49 per cent respectively.

Average sale prices per square foot, based on transactions for which selling prices were disclosed, were up substantially for the industrial and commercial/retail segments. Over the same period, the average selling price for office properties was down.

“Given that the pace of sales was slower this year compared to last, the large average selling price increases for industrial and commercial/retail properties were more associated with a change in the composition of sales. For example, in the Fourth Quarter of 2012, there was greater proportion of industrial sales in smaller size categories compared to the Fourth Quarter of 2011. All else being equal, smaller properties tend to sell at a higher price per square foot,” continued Lai.

Untitled-33

GTA REALTORS Release Monthly Resale Housing Figures

Greater Toronto Area REALTORS® reported 3,690 sales through the TorontoMLS system in December 2012 – down from 4,585 sales in December 2011. Total sales for 2012 amounted to 85,731 – down from 89,096 transactions in 2011.

“The number of transactions in 2012 was quite strong from a historic perspective. We saw strong year-over-year growth in sales in the first half of the year, but this growth was more than offset by sales declines in the second half. Stricter mortgage lending guidelines resulted in some households postponing their purchase of a home. In the City of Toronto, the dip in sales was compounded by the additional Land Transfer Tax, which buyers must pay upfront,” said Toronto Real Estate Board (TREB) President Ann Hannah.

The average selling price in December 2012 was up by 6.5 per cent year-over-year to $478,739. The average selling price for 2012 as a whole was up by almost seven per cent to $497,298.

“Robust annual rates of price growth were reported through most months of 2012. Price growth was strongest for low-rise homes, including singles, semis and townhouses. Despite a dip in sales, market conditions remained tight for these home types with substantial competition between buyers,” said TREB’s Senior Manager of Market Analysis Jason Mercer.

Untitled-32

GTA Commercial REALTORS Release MonthlyCommercial Market Figures

Toronto Real Estate Board (TREB) Commercial Division Members reported 486,656 leased square feet of industrial, commercial/retail and office space through the TorontoMLS system in November 2012. This result was down by 27 per cent in comparison to November 2011.

Industrial properties accounted for 85 per cent of space leased, or 413,886 square feet – down by 21 per cent compared to last year. While the amount of industrial space leased was down year-over-year, the average lease rate for transactions undertaken on a per square foot net basis was up by four per cent to $5.14.

“A key theme in any discussion regarding the Canadian economy this year has been uncertainty. While economic growth in Canada continues to be driven by domestic consumer and business spending, growth in the export sector, which is so important to industrial concerns in the GTA, has continued to be anemic. Recession in Europe and slow growth in the United States and Asia have been at the root of this problem. This economic uncertainty has translated into less industrial space leased compared to a year ago, as some firms have put their real estate investment decisions on hold,” said TREB Commercial Division Chair Cynthia Lai.

There were 50 sales of industrial, commercial/retail and office properties in November 2012 – down by 19 per cent in comparison to November 2011. Sales were more evenly distributed by market segment, in comparison to the leasing market, with 36 per cent of transactions accounted for by industrial properties, 42 per cent accounted for by commercial/retail properties and 22 per cent accounted for by office properties.

The average selling price per square foot for transactions where pricing was disclosed was up on a year-over-year basis for industrial and commercial/retail properties, while the price was down for office properties.

“The year-over-year change in the average selling prices was likely due to a combination of a change in market conditions in some parts of the GTA compared to last year and a change in the mix of properties sold this year compared to last,” added Lai.

Untitled-35