GTA Commercial REALTORS Report Commercial Market Figures

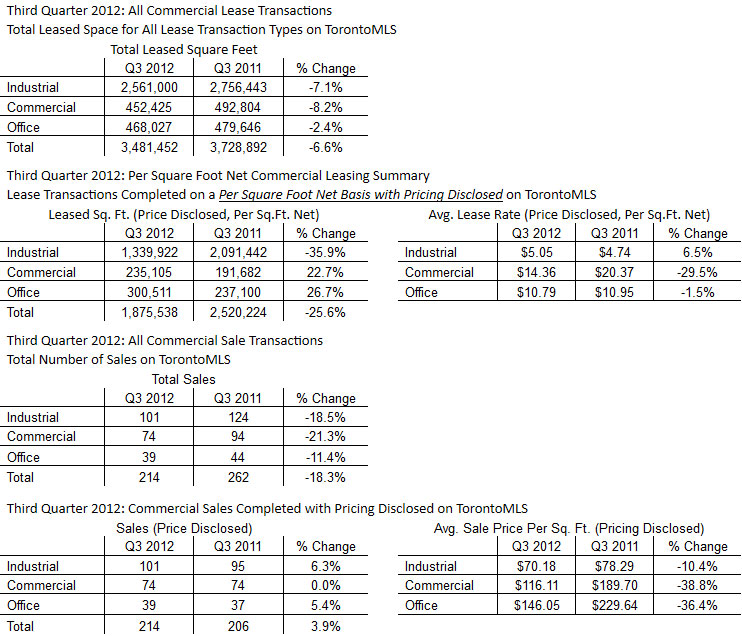
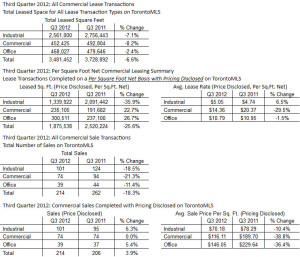
Toronto Real Estate Board (TREB) Commercial Division Members reported lease transactions accounting for almost 3.5 million square feet of industrial, commercial/retail and office space during the Third Quarter of 2012. This result was down from slightly more than 3.7 million square feet leased in the Third Quarter of 2011.

The year-over-year change in average lease rates was mixed. Based on transactions for which pricing was disclosed, the average industrial lease rate was up compared to last year whereas average commercial/retail and office lease rates were down.

“The industrial market segment accounted for almost three-quarters of total leased space in the Third Quarter. Average lease rates were up for all industrial size categories reported by TREB. If growth in average industrial lease rates continues in the Fourth Quarter and into 2013, it would suggest that market conditions are tightening with industrial firms in southern Ontario more confident about future growth,” said TREB Commercial Division Chair Cynthia Lai.

Commercial Division Members reported 214 combined commercial sales in the Third Quarter – down 18 per cent from 262 sales during the same period in 2011. The average selling price was down for all three categories, but a comparison of transactions suggests that the decline was more the result of a different mix of property types sold this year compared to last, especially in relation to commercial/retail and office space.

“The mix of sold office space shifted towards larger properties in the Third Quarter of this year. Generally speaking, larger office properties are associated with a lower price per square foot. As a result, when larger properties account for a greater proportion of total transactions the overall average lease rate tends to dip, all else being equal,” said Lai.

“The dip in the in the average commercial/retail sale price was also driven by sales of larger properties. Last year the mix and use of larger commercial/retail properties sold dictated a higher price compared to this year. For transactions in smaller size categories, average selling prices were more comparable between 2012 and 2011,” continued Lai.

Untitled-43

GTA REALTORS Release Monthly Resale Housing Figures

Greater Toronto Area (GTA) REALTORS® reported 5,879 transactions through the TorontoMLS system in September 2012.  The average selling price for these transactions was $503,662, representing an increase of more than 8.5 per cent compared to last year.

The number of transactions was down by 21 per cent in comparison to September 2011.  However, it is important to note that there were two fewer working days in September 2012 compared to September 2011. The majority of transactions are entered on working days. On a per working day basis, sales were down by 12.5 per cent year-over-year.

“While sales have been lower due to stricter mortgage lending guidelines, we continue to see substantial competition between buyers.  The months of inventory trend remains low from a historic perspective, which explains the strong price increases we are experiencing,” said Toronto Real Estate Board President Ann Hannah.

September average selling prices were up compared to last year for all major home types.  Price growth was strongest in the City of Toronto, including condominium apartments with eight per cent year-over-year growth.  All benchmark home types included in the MLS® Home Price Index (MLS® HPI) experienced year-over-year price increases, with substantially stronger increases for low-rise home types.

“Barring a major change to the consensus economic outlook, home price growth is expected to continue through 2013.  Based on inventory levels, price growth will be strongest for low-rise home types, including single-detached and semi-detached houses and town homes,” said TREB’s Senior Manager of Market Analysis, Jason Mercer.

Untitled-42

GTA REALTORS Release Mid-Month Resale Figures

Greater Toronto Area (GTA) REALTORS® reported 2,544 transactions through the TorontoMLS system in the first 14 days of September. This result was down by 15 per cent compared to the 2,995 sales reported during the same period in 2011.

“The combination of stricter lending guidelines, rising home prices and the added upfront cost associated with the land transfer tax in the City of Toronto resulted in a slower pace of sales during the summer of 2012 compared to a year ago,” said Toronto Real Estate Board (TREB) President Ann Hannah.

The average selling price for sales during the first two weeks of September was $496,786 – representing an annual rate of increase of more the 9.5 per cent. Average selling prices were up for both low-rise and high-rise home types, including condominium apartments sold in the ‘416’ area code.

“Price growth continued to be strongest for low-rise home types during the first two weeks of September. This segment of the market has been very tight, with months of inventory remaining low from a historic perspective,” said Jason Mercer, TREB’s Senior Manager of Market Analysis.

Untitled-44

GTA REALTORS Report Mid-Month Resale Housing Market Figures

Greater Toronto Area REALTORS® reported 2,857 transactions through the TorontoMLS system during the first 14 days of August 2012. This mid-month result represented a dip of 7.6 per cent in comparison to 3,091 sales reported during the same period in 2011.

“A number of factors played into the dip in sales in the first half of August. Sales growth in the spring was very strong, suggesting that some buyers sped up their decision to buy. Stricter mortgage lending guidelines that came into effect at the beginning of July likely prompted some households to put their buying decision on hold. Finally, relatively higher home prices and the additional upfront cost of the City’s Land Transfer Tax go a long way to explain the more pronounced dip in sales in the ‘416’ area code,” said Toronto Real Estate Board (TREB) President Ann Hannah.

The average selling price for the first two weeks of August in the Greater Toronto Area was $480,180 – up 9.2 per cent in comparison to 2011.

“The strong annual rate of price growth so far in August was driven by the single-detached market segment, particularly in the City of Toronto. While this segment of the market has been consistently tight over the past year, the strong double-digit price growth for single-detached houses in the City suggests that the mix of houses sold this year compared to last also changed, with higher end homes accounting for a greater share of sales this year,” said Jason Mercer, TREB’s Senior Manager of Market Analysis.

Untitled-45