
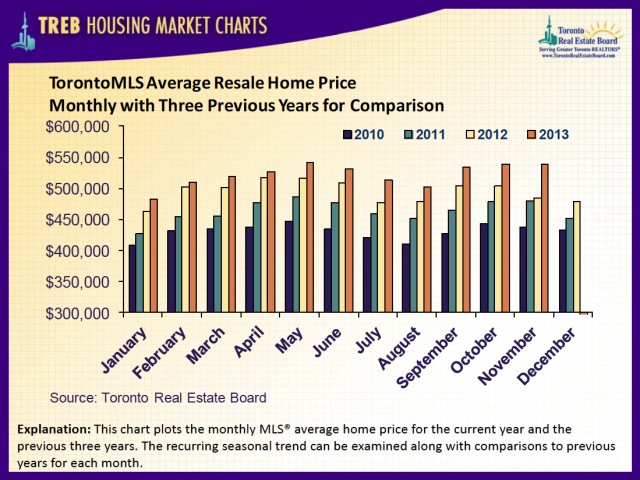
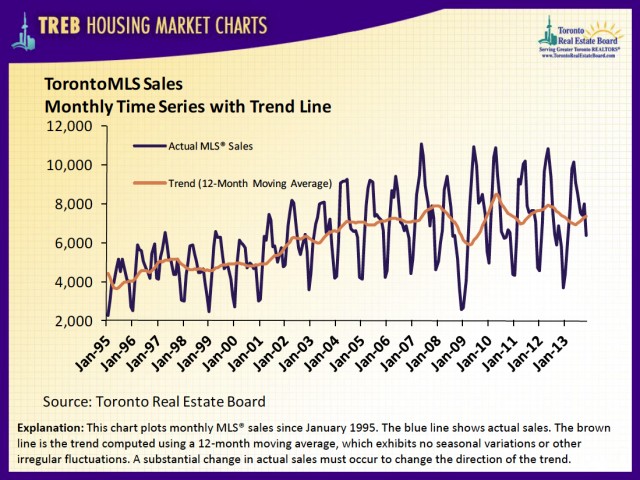
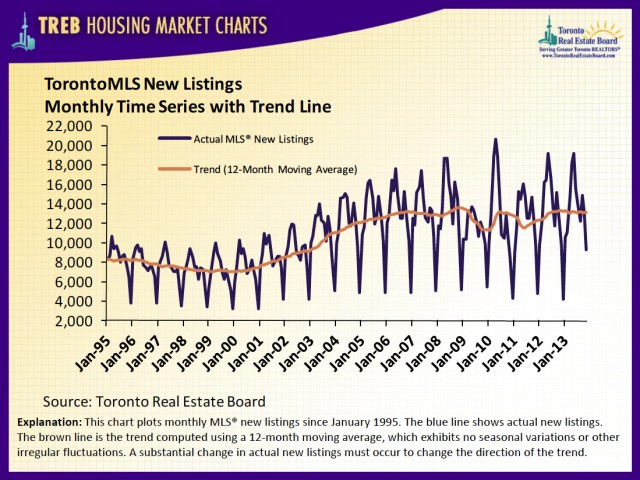
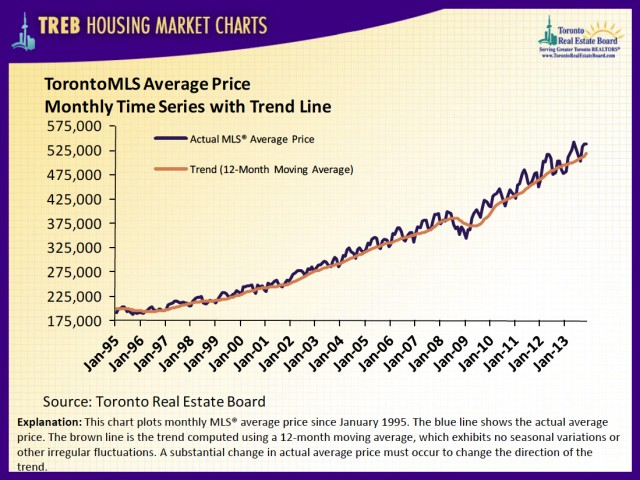
A series of charts summarizing key residential statistics for the GTA.
November 2013
A series of charts summarizing key residential statistics for the GTA.
In light of the launch of the City of Toronto’s 2014 budget-setting process, the Toronto Real Estate Board (TREB) has released the results of new public opinion research that shows a strong majority of Torontonians, 69 percent, support a phase-out of the Toronto Land Transfer Tax, up four points from May 2013.
The poll was conducted by Ipsos Reid and found that:
“Torontonians overwhelmingly support a phase-out of the Toronto Land Transfer Tax. They have waited long enough. A phase-out of this unfair tax should start with the City’s 2014 budget,” said Dianne Usher, TREB President.
Toronto is the only municipality in Ontario where home buyers are forced to pay a municipal land transfer tax. This tax costs the buyer of an average detached Toronto home $12,500, which has to be paid in full to City Hall, up front, as a closing cost, and cannot be tacked on to a mortgage. This is in addition to a similar amount payable to the Province.
“This tax penalizes growing families and retirees simply for changing their living arrangements to accommodate their new needs and priorities at a time when they can least afford it. It even forces many first-time buyers, who often struggle to save for a down payment, to pay thousands because the City’s first-time buyer rebate has not kept pace with inflation,” said Usher. “Furthermore, because of the way the tax is structured, even someone purchasing a home priced below the City’s current average price of $564,000, is being charged the highest Land Transfer Tax rate, which kicks in on homes priced over $400,000.”
The amount that City Hall collects in Land Transfer Tax from each average re-sale home purchase has increased by 78 percent since the tax took effect in 2008, more than twice the rate of home price increases over the same time period.
“City Hall has been cashing in on the Land Transfer Tax at a rate that greatly outpaces inflation,” said Usher.
REALTORS® are also highlighting the surplus generated by the Toronto Land Transfer Tax.
“City Hall has collected over $300 million more than budgeted from the Land Transfer Tax, since it took effect in 2008. That means home buyers are being over-taxed,” said Von Palmer, TREB’s Chief Government and Public Affairs Officer.
TREB will be participating in the City’s 2014 Budget process, and is encouraging the public to speak out against the Toronto Land Transfer Tax at www.LetsGetThisRightToronto.ca.
“We have been consistently, and loudly, speaking out on behalf of Torontonians on this issue and we will continue to do so because it is the right thing to do,” added Palmer.
These are some of the findings of an Ipsos Reid poll conducted from Oct 30th to Nov 4th on behalf of TREB. For this survey a sample of 600 residents of the City of Toronto was interviewed online. The results are accurate to within +/- 4.6 percentage points had all Torontonians been surveyed.
In celebration of National Housing Day the Toronto Real Estate Board (TREB) is teaming up with related organizations to host a symposium at Daniel Spectrum Artscape Lounge in Regent Park November 22nd, highlighting positive initiatives and challenges related to affordable housing.
“We are delighted to be hosting this year’s National Housing Day symposium in Regent Park, as it serves as a fine example that healthy communities are derived from quality affordable housing options,” said TREB President Dianne Usher. “Our city’s exemplary world standing depends on the development of more neighbourhoods like this one.”
The symposium will feature keynote speaker Spider Jones, an award-winning journalist and former three-time Golden Glove champion who traces his beginnings to the gang-infested, inner-city projects of Detroit and Windsor. The extraordinary path his life has taken gives him a unique ability to connect with, and motivate young people through Believe to Achieve; a youth outreach development and counselling charity.
Representatives from the City of Toronto, Habitat for Humanity Toronto and Ontario credit unions will also be on hand to share their perspectives on issues related to affordable housing.
“The City of Toronto is pleased to celebrate our partnerships with the private sector, non- profit organizations and other governments,” said Councillor Ana Bailao, Chair of the Affordable Housing Committee. “Together, we will continue to successfully create affordable homes and healthy mixed-income communities across Toronto.”
Catering for the event will be provided by Paintbox Bistro Catering, which has played a key role in the revitalization of Regent Park, offering start-up companies use of kitchen facilities, storage space, a business address, shared support services, and business and professional development training.
“When government, industry, non-profit organizations and the private sector come together to share their perspectives on fostering affordable housing communities, inspired solutions follow,” said Ms. Usher.
As part of the symposium participants will be asked to work in groups to construct gingerbread houses – purchased as a charitable donation to Habitat for Humanity Toronto’s Gingerbread Build fundraising campaign – as they focus discussions on affordable housing issues.
“Developing affordable housing solutions is a formidable challenge, but of vital importance to the economic health and wellbeing of the entire city,” says Habitat for Humanity Toronto’s CEO Ene Underwood. “By sharing and developing ideas with our partners, we can better generate solutions for affordable housing in Toronto, making a better city for all.”
In addition to supporting Habitat for Humanity Toronto, Greater Toronto REALTORS® regularly assist a number of other shelter-related causes through the REALTORS® Care Foundation, which offers grants throughout the province on an annual basis. Last year alone, Greater Toronto REALTORS® contributed more than $440,000 to the REALTORS® Care Foundation and distributed grants to 38 organizations throughout the GTA.
Greater Toronto REALTORS® also foster consumer efforts to achieve home ownership by offering guidance on options such as the Five Per Cent Down Payment Program, the RRSP Home Buyers’ Plan and various tax rebates, which make home buying more affordable.
“As a number of studies have illustrated, the benefits of home ownership include improved financial stability, physical health, personal safety and academic scores,” said Ms. Usher. “Given the positive, far reaching effects of home ownership, Greater Toronto REALTORS® regard their contribution to National Housing Day celebrations as an investment in our city’s future.”
The National Housing Day Symposium takes place November 22nd, 2013 from 7:30am to 10:00am at Daniel Spectrum Artscape Lounge in Regent Park, (585 Dundas Street East, Toronto).
Greater Toronto REALTORS® are passionate about their work. They are governed by a strict Code of Ethics and share a state-of-the-art Multiple Listing Service. Over 37,000 TREB Members serve consumers in the Greater Toronto Area. The Toronto Real Estate Board is Canada’s largest real estate board.
Media Relations contact information:
Mary Gallagher, Toronto Real Estate Board
Senior Manager Public Affairs (416) 443-8158 maryg@trebnet.com
Gil Hardy, City of Toronto
Affordable Housing Office (416)-397-4701 ghardy@toronto.ca
Joanna M. Dwyer
Director, Marketing & Communications, Habitat for Humanity Toronto
Phone: 416 755 7353 ext.259 Cell: 416 708-6481
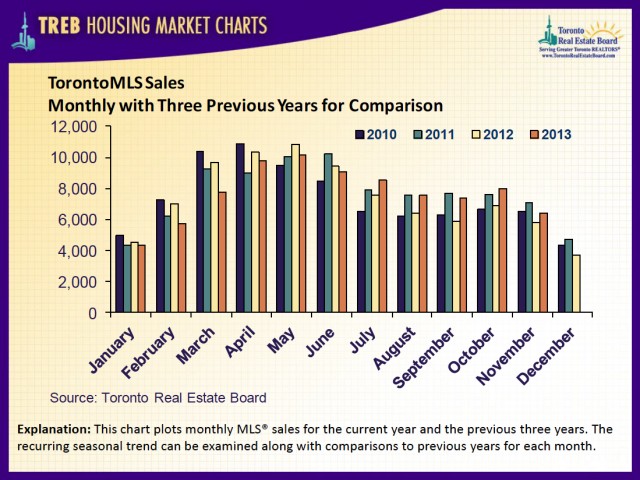
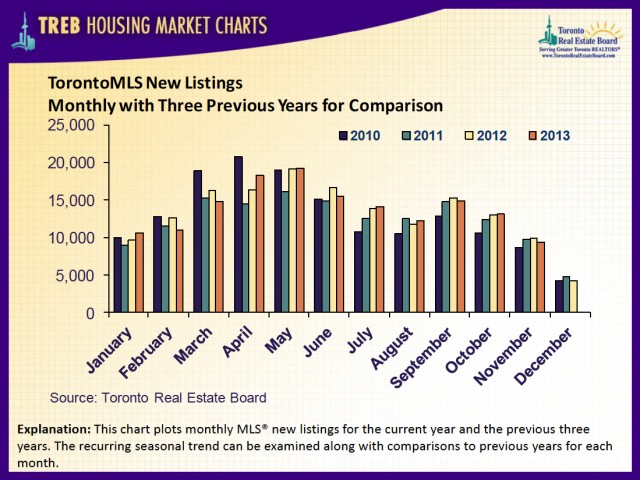
Greater Toronto Area REALTORS® reported 3,131 residential transactions through the TorontoMLS system during the first two weeks of November 2013. This result represented a 21 per cent year-over-year increase compared to 2,582 sales reported during the same timeframe in 2012. Over the same period, new listings were down by more than four per cent.
“The results for mid-November indicate that GTA households remain comfortable with the costs of home ownership,” said Toronto Real Estate Board President Dianne Usher. “If not for the persistent shortage of listings for most home types, we would likely be experiencing an even higher level of sales as more buyers would be able to make a deal on a home meeting their needs.”
The average selling price for November 2013 mid-month transactions was $538,708, representing an 11 per cent increase compared to $485,988 in 2012.
“More buyers competing for a smaller number of listings has translated into an accelerating pace of price growth. This theme has been most prevalent in the low-rise market segment, including single-detached and semi-detached houses and townhomes. However, it is important to note that the condominium apartment market has also become tighter,” said Jason Mercer, TREB’s Senior Manager of Market Analysis.
| TorontoMLS Sales & Average Price By Home Type November 1 – 14, 2013 | |||||||||||||
| Sales | Average Price | ||||||||||||
| 416 | 905 | Total | 416 | 905 | Total | ||||||||
| Detached | 468 | 1,067 | 1,535 | 845,883 | 595,545 | 671,869 | |||||||
| Yr./Yr. % Change | 43.1% | 19.5% | 25.8% | 11.5% | 7.7% | 10.5% | |||||||
| Semi-Detached | 133 | 202 | 335 | 662,447 | 427,599 | 520,837 | |||||||
| Yr./Yr. % Change | 6.4% | 24.7% | 16.7% | 10.9% | 10.1% | 8.6% | |||||||
| Townhouse | 125 | 352 | 477 | 477,096 | 378,518 | 404,351 | |||||||
| Yr./Yr. % Change | 5.9% | 20.1% | 16.1% | 9.3% | 6.9% | 7.0% | |||||||
| Condo Apartment | 526 | 205 | 731 | 395,865 | 274,664 | 361,876 | |||||||
| Yr./Yr. % Change | 19.8% | 15.8% | 18.7% | 14.1% | -0.6% | 10.8% | |||||||
| Summary of TorontoMLS Sales and Average Price November 1 – 14 | |||||||||||||
| 2013 | 2012 | ||||||||||||
| Sales | Average Price | New Listings | Sales | Average Price | New Listings | ||||||||
| City of Toronto (“416”) | 1,259 | $598,924 | 2,049 | 1,025 | $518,825 | 2,196 | |||||||
| Rest of GTA (“905”) | 1,872 | $498,210 | 2,941 | 1,557 | $464,371 | 3,018 | |||||||
| GTA | 3,131 | $538,708 | 4,990 | 2,582 | $485,988 | 5,214 | |||||||
Toronto Real Estate Board Commercial Division Members reported almost 506,000 combined square feet of leased industrial, commercial/retail and office space through the TorontoMLS system in October 2013.
This result was down compared to October 2012, when 821,118 square feet of leased space was reported. Lease transactions reported include those undertaken on a per square foot net basis for which pricing was disclosed.
Average lease rates were up on a year-over-year basis for the three major property types. The annual increases were based on market factors and changes in the characteristics of properties sold this year compared to last.
“While the amount of leased space was down this past October in comparison to the same period in 2012, it is important to note that we do see volatility in the commercial leasing market from one month to the next. Continued growth in the Canadian economy, albeit at a slightly slower pace than originally expected, should provide a foundation for sustained demand for commercial space in the GTA,” said TREB Commercial Division Chair Cynthia Lai.
There were a combined 61 industrial, commercial/retail and office property sales reported through the TorontoMLS system in October 2013 – up from 55 sales recorded in October 2012.
Annual changes in average sale prices were mixed for transactions where pricing was disclosed, depending on market segment. Average selling prices on a per square foot basis for industrial and commercial/retail properties were up in October, whereas the average sale price for office properties was down.
“Recent reports suggest that it will take longer than originally expected for the economy to reach full capacity. The impact of this could be mitigated by the expectation that borrowing costs will remain low over the next year, which may prompt businesses to make further capital investments including real estate acquisition,” continued Ms. Lai
|
October 2013: Per Square Foot Net Commercial Leasing Summary |
|||||||||
|
Lease Transactions Completed on a Per Square Foot Net Basis with Pricing Disclosed on TorontoMLS |
|||||||||
| Leased Square Feet | Average Lease Rate | ||||||||
|
|
Oct. 2013 | Oct. 2012 | % Change | Oct. 2013 | Oct. 2012 | % Change | |||
|
Industrial |
408,928 | 715,787 | -42.9% |
Industrial |
$5.57 | $3.96 | 40.9% | ||
|
Commercial |
47,244 | 57,567 | -17.9% |
Commercial |
$21.32 | $15.73 | 35.5% | ||
|
Office |
49,803 | 47,764 | 4.3% |
Office |
$12.46 | $11.62 | 7.2% | ||
|
Total |
505,975 | 821,118 | -38.4% | ||||||
|
Source: TREB Commercial Division |
|||||||||
|
October 2013: Commercial Sales Completed with Pricing Disclosed on TorontoMLS |
|||||||||
| Sales (Price Disclosed) | Avg. Sale Price Per Sq. Ft. (Pricing Disclosed) | ||||||||
|
|
Oct. 2013 | Oct. 2012 | % Change | Oct. 2013 | Oct. 2012 | % Change | |||
|
Industrial |
26 | 23 | 13.0% |
Industrial |
$100.13 | $94.97 | 5.4% | ||
|
Commercial |
25 | 23 | 8.7% |
Commercial |
$186.77 | $171.58 | 8.9% | ||
|
Office |
10 | 9 | 11.1% |
Office |
$177.85 | $219.36 | -18.9% | ||
|
Total |
61 | 55 | 10.9% | ||||||
|
Source: TREB Commercial Division |
|||||||||
|
NOTE: Some table totals may differ due to conversion and rounding. |
|||||||||
Greater Toronto Area REALTORS® reported 8,000 home sales through the TorontoMLS system in October 2013 – up from 6,713 transactions reported in October 2012. Over the same period, new listings on the TorontoMLS system were down.
“The GTA home ownership market has been broadly characterized by a rebound in sales since the summer. Market conditions have been tighter in some market segments more so than others. Ground-oriented homes listed for below one million dollars in some areas of the GTA have been especially popular with buyers, while listings for these home types have been constrained,” said Toronto Real Estate Board President Dianne Usher.
“The supply of listings for many home types and price points has either been down year-over-year or at least not up by the same annual rate as sales. The additional Land Transfer Tax in the City of Toronto and the removal of the government guarantee on high ratio mortgages for home purchases over one million dollars have arguably led many homeowners not to list,” continued Ms. Usher.
The average selling price for TorontoMLS sales in October 2013 was $539,058– up by more than seven per cent in comparison to the average price of $502,127 in October 2012. The MLS® Home Price Index (MLS® HPI) Composite Benchmark was up by 4.5 per cent year-over-year.
“Growth in the average selling price and the MLS® HPI Composite Benchmark will continue through 2014. Inventory levels for ground-oriented home types will be low from a historic perspective and home ownership demand will stay strong as affordability remains in check due to the continuation of accommodative borrowing costs,” said Jason Mercer, the Toronto Real Estate Board’s Senior Manager of Market Analysis.
| Summary of TorontoMLS Sales and Average Price October 1 – 31, 2013 | |||||||||||||
| 2013 | 2012 | ||||||||||||
| Sales | Average Price | New Listings | Sales | Average Price | New Listings | ||||||||
|
City of Toronto (“416”) |
3,190 | $593,807 | 5,349 | 2,673 | $538,120 | 5,837 | |||||||
|
Rest of GTA (“905”) |
4,810 | $502,748 | 7,761 | 4,040 | $478,313 | 7,848 | |||||||
|
GTA |
8,000 | $539,058 | 13,110 | 6,713 | $502,127 | 13,685 | |||||||
| TorontoMLS Sales & Average Price By Home Type October 1 – 31, 2013 | |||||||||||||
| Sales | Average Price | ||||||||||||
| 416 | 905 | Total | 416 | 905 | Total | ||||||||
|
Detached |
1,125 | 2,695 | 3,820 | 873,509 | 607,849 | 686,087 | |||||||
|
Yr./Yr. % Change |
23.6% | 15.4% | 17.7% | 12.4% | 6.3% | 9.0% | |||||||
|
Semi-Detached |
331 | 514 | 845 | 642,112 | 417,124 | 505,255 | |||||||
|
Yr./Yr. % Change |
-2.4% | 15.5% | 7.8% | 11.7% | 6.7% | 7.4% | |||||||
|
Townhouse |
355 | 915 | 1,270 | 473,240 | 378,688 | 405,118 | |||||||
|
Yr./Yr. % Change |
26.3% | 20.7% | 22.2% | 4.0% | 6.0% | 5.5% | |||||||
|
Condo Apartment |
1,347 | 560 | 1,907 | 384,441 | 295,166 | 358,225 | |||||||
|
Yr./Yr. % Change |
20.4% | 35.6% | 24.5% | 7.2% | 4.3% | 5.9% | |||||||
Lorem ipsum dolor sit amet, consectetuer adipiscing elit. Aenean commodo ligula eget dolor. Aenean massa. Cum sociis natoque penatibus et magnis dis parturient montes, nascetur ridiculus mus.
Donec quam felis, ultricies nec, pellentesque eu, pretium quis, sem. Nulla consequat massa quis enim. Donec pede justo, fringilla vel, aliquet nec, vulputate eget, arcu.

Greater Toronto Area REALTORS® reported 3,460 sales through the TorontoMLS system during the first 14 days of October 2013. This result was up by 21 per cent in comparison to 2,849 sales reported during the same period in 2012. October mid-month sales were also up by 13 per cent compared to the 10-year average.
“With October mid-month sales well-above the 10-year average, it seems clear that we have more than recovered from the temporary dip in residential transactions that resulted from the onset of stricter mortgage lending guidelines,” said Toronto Real Estate Board President Dianne Usher.
“It is also important to note that the supply of ground-oriented listings remains constrained, due in part to the additional land transfer tax and stricter lending guidelines. If this were not the case, the number of sales could have been greater because more households would have been able find a home to purchase,” continued Ms. Usher.
The average selling price for October mid-month transactions was $536,301 – up 7.3 per cent compared to the first 14 days of October 2012.
“Price growth has been stronger in the second half of 2013, as sales growth has outstripped growth in listings. There have been more buyers competing for available properties compared to the first half of the year, which has led to increased upward pressure on average selling prices,” said Jason Mercer, the Toronto Real Estate Board’s Senior Manager of Market Analysis.

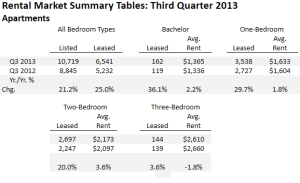
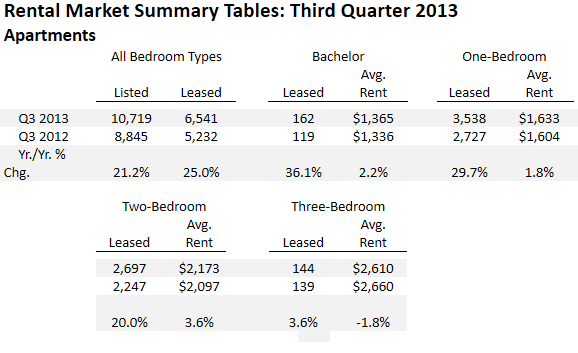
Greater Toronto Area REALTORS® reported 6,541 condominium apartments rented through the TorontoMLS system in the third quarter of 2013. This result was up by 25 per cent in comparison to the third quarter of 2012. The number of condominium apartments listed for rent on the TorontoMLS system during the third quarter was up by 21 per cent year-over-year to 10,719.
Approximately 80 per cent of condominium apartment rental transactions took place in the City of Toronto. In addition, there was a substantial number of rentals reported in parts of Peel Region and York Region.
“Almost one-third of GTA households rent the home in which they live. Given that we have experienced sustained population growth in the region, it makes sense that rental transactions have been increasing as well. Investor-owned condominium apartments are popular because of the modern finishes and amenities offered by many of these properties,” said Toronto Real Estate Board President Dianne Usher.
Third quarter average rents were up for one-bedroom and two-bedroom condominium apartments by 1.8 per cent and 3.6 per cent respectively on an annual basis.
“Competition between renters for available units increased in the third quarter. This is why we continued to see year-over-year growth in average rents for the popular one-bedroom and two-bedroom unit types,” said Jason Mercer, the Toronto Real Estate Board’s Senior Manager of Market Analysis.
Greater Toronto Area REALTORS® reported 5,307 condominium apartment transactions through the TorontoMLS system in the third quarter of 2013. This result was up by 18 per cent in comparison to 4,498 condominium apartment sales reported for the third quarter of 2012. In the City of Toronto, which accounted for 72 per cent of condominium apartment transactions, sales were up by 19.5 per cent.
“The Echo Generation wants to live close to where they work and play. It makes sense that they have turned to condominium apartments as they have moved into home ownership. Many condominium apartments in the GTA are characterized by their proximity to a diversity of employment, transportation and leisure alternatives,” said Toronto Real Estate Board President Dianne Usher.
“A growing number of buyers have restarted their search for a condominium apartment since the summer. Despite the onset of stricter lending guidelines, buyers have found that home ownership remains affordable,” continued Ms. Usher.
The average selling price for condominium apartments in the third quarter of 2013 was $340,069 – up almost two per cent in comparison to the average of $333,846 in the third quarter of 2012.
“We experienced a moderate annual rate of increase in the average condo price. However, while condo sales were up, listings were down in the third quarter. If this trend continues, it could point to increased competition between condo buyers and an uptick in the pace of price growth moving forward,” said Jason Mercer, TREB’s Senior Manager of Market Analysis
|
Condominium Apartment Market Summary |
||||||
|
Third Quarter 2013 |
||||||
| 2013 | 2012 | |||||
| Sales | Average Price | Sales | Average Price | |||
| Total TREB | 5,307 | $340,069 | 4,498 | $333,846 | ||
| Halton Region | 136 | $339,204 | 89 | $328,105 | ||
| Peel Region | 750 | $252,921 | 710 | $252,419 | ||
| City of Toronto | 3,816 | $360,533 | 3,192 | $356,677 | ||
| York Region | 469 | $343,044 | 386 | $329,314 | ||
| Durham Region | 125 | $235,675 | 112 | $228,093 | ||
| Other Areas | 11 | $252,991 | 9 | $227,222 | ||