GTA Commercial REALTORS Report Commercial Market Figures

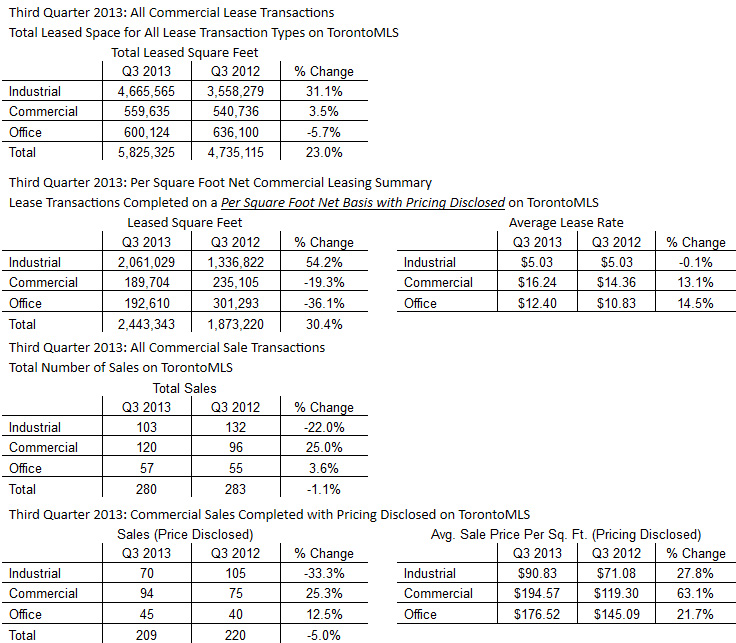
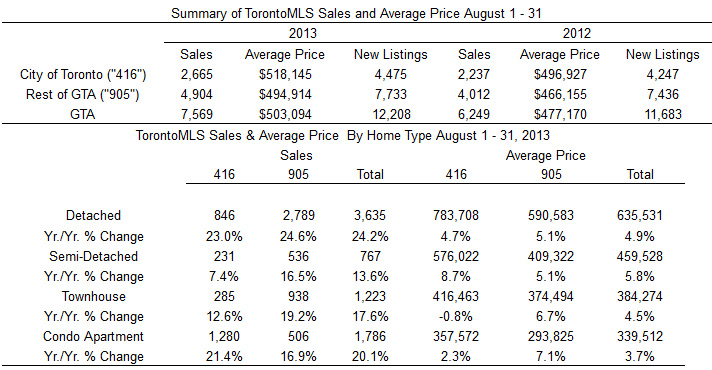
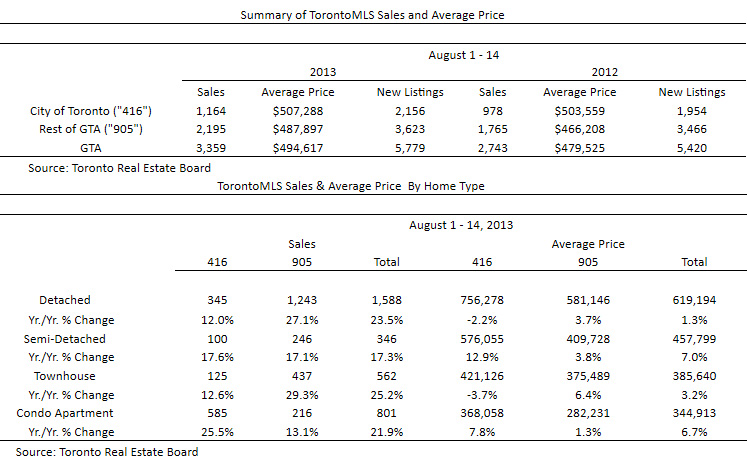
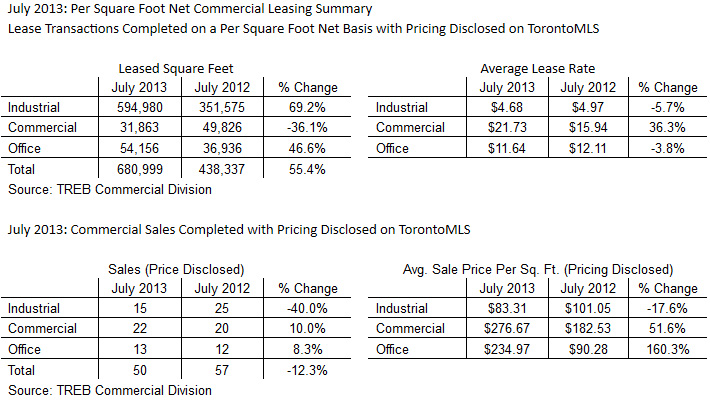
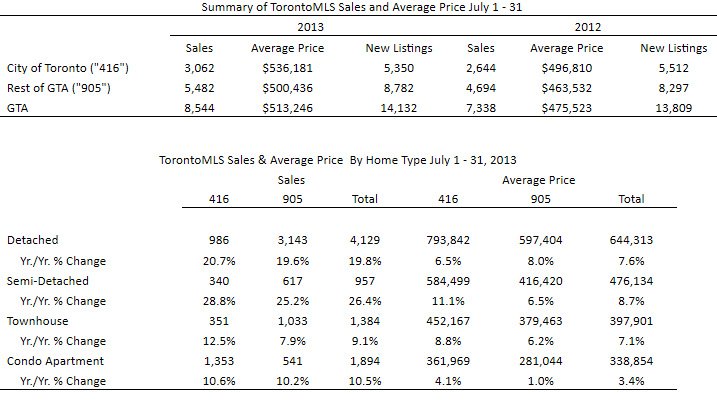
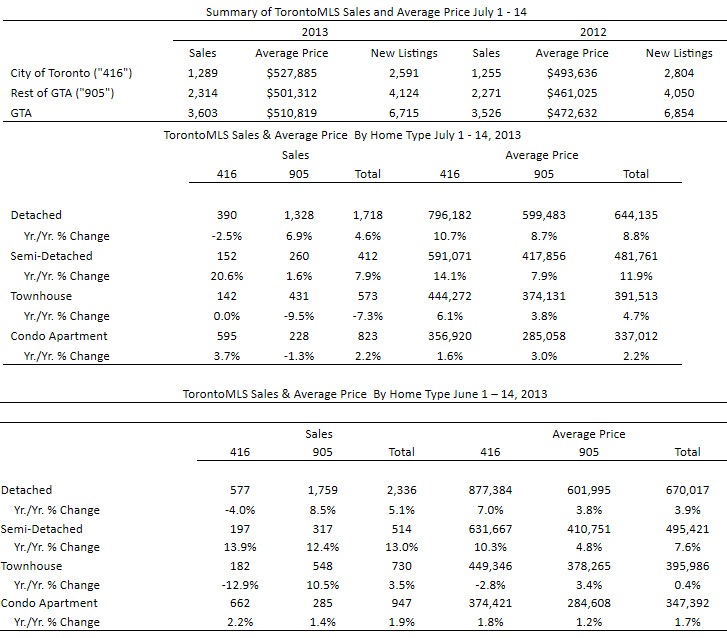
Toronto Real Estate Board Commercial Division Members reported over 5.8 million square feet of leased space in the third quarter of 2013.  This result was up by 23 per cent in comparison to approximately 4.7 million square feet leased in the third quarter of 2012.  The increase in leased space was driven by a surge in industrial leasing activity, with the amount of leased industrial space up by 31 per cent on a year-over-year basis to over 4.6 million square feet.  Industrial space accounted for 80 per cent of total space leased.

 The third quarter 2013 average lease rate for industrial properties transacted on a per square foot net basis, where pricing was disclosed, was unchanged compared to the same period in 2012, at $5.03.  The average commercial/retail and office per square foot net lease rates were up by 13.1 per cent and 14.5 per cent to $16.24 and $12.40 respectively on a year-over-year basis.

“The annual growth in the amount of space leased in the third quarter, particularly in the industrial market segment, suggests that businesses in the Greater Toronto Area are expecting stronger growth over the next year.  In anticipation of more robust economic activity, many of these businesses have taken on more space in order to account for increased demand for their goods or services moving forward,” said TREB Commercial Division Chair Cynthia Lai.

 Combined industrial, commercial/retail and office property sales in the third quarter of 2013, at 280, were almost unchanged compared to 283 sales reported during the third quarter of 2012.  The strongest sales growth was experienced in the commercial/retail market segment, with the number of deals up by 25 per cent year-over-year.

 Average selling prices reported on a per square foot basis, for transactions with pricing disclosed, were up on a year-over-year basis for all major property types.

 “Two factors arguably contributed to the average annual sale price increases experienced in the third quarter.  First, an increase in demand for some property types in some areas of the GTA, particularly in the commercial/retail and office segments where sales were up, likely played a role.  Second, there was a change in the geography and size of properties sold this year compared to last.  For example, this year there was a higher percentage of smaller commercial/retail properties sold.  All else being equal, smaller properties tend to sell for more on a per square foot basis than larger properties,” continued Ms. Lai.

Untitled-4

GTA REALTORS RELEASE MONTHLY RESALE HOUSING FIGURES

Greater Toronto Area REALTORS® reported 7,411 residential sales through the TorontoMLS system in September 2013, representing a 30 per cent increase compared to 5,687 transactions reported in September 2012. Year-to-date, total residential sales reported through TorontoMLS amounted to 68,907 during the first nine months of 2013 – down by one per cent compared to the same period in 2012.

“It’s great news that households have found that the costs of home ownership, including mortgage payments, remain affordable. This is why the third quarter was characterized by renewed growth in home sales in the GTA. We expect to see sales up for the remainder of 2013, as the pent-up demand that resulted from stricter mortgage lending guidelines continues to be satisfied,” said Toronto Real Estate Board President Dianne Usher.

The average selling price for September transactions was $533,797 – up by 6.5 per cent year-over-year. Through the first three quarters of 2013, the average selling price was $520,118 – up by over four per cent compared to the first nine months of 2012.

The MLS® Home Price Index composite benchmark for September was up by four per cent year-over-year. The annual rate of growth for the composite benchmark has been accelerating since the spring of 2013.

“The price growth story in September continued to be about strong demand for low-rise home types, coupled with a short supply of listings. Even with slower price growth and month-to-month volatility in the condo apartment market, overall annual price growth has been well above the rate of inflation this year. This scenario will continue to play out through the remainder of 2013,” said Jason Mercer, TREB’s Senior Manager of Market Analysis.

Untitled-3

GTA REALTORS Release Mid-Month Resale Housing Figures

Greater Toronto Area REALTORS® reported 3,158 transactions through the TorontoMLS system during the first 14 days of September 2013. This result was up by 29 per cent in comparison to September 2012. Sales were up for all major home types on a year-over-year basis. The condominium apartment segment led the way with strong sales growth in the City of Toronto.

“The strong growth in sales that we have seen over the past two-and-a-half months indicates that GTA households are approaching home ownership with a renewed sense of confidence. Prospective home buyers have taken a hard look at their household balance sheets over the past year and have found that, despite stricter lending guidelines, there are affordable property types from which to choose,” said Toronto Real Estate Board President Dianne Usher.

The number of new listings entered into the TorontoMLS system was down slightly in comparison to the same period in 2012. Strong sales growth coupled with a slight reduction in new listings points to increased competition between buyers in some market segments and the continuation of above-inflation rates of price growth. The average selling price at mid-month September was up by four per cent on an annual basis to $514,560.

“With months of inventory remaining low from a historic perspective and evidence of tighter market conditions during the summer, the only argument that makes sense is for continued home price growth in the Greater Toronto Area for the remainder of 2013,” said Jason Mercer, TREB’s Senior Manager of Market Analysis.

Untitled-5

GTA Commercial REALTORS Report Commercial Market Figures

Toronto Real Estate Board Commercial Division Members reported almost 488,000 square feet of leased space through the TorontoMLS system in August 2013. This result represented a substantial increase over the 247,382 square feet of space leased during the same period in 2012. The industrial segment accounted for 77 per cent of the total space leased.

Year-over-year growth in average lease rates, for transactions undertaken on a per square foot net basis for which pricing was disclosed, was mixed. The average industrial lease rate was $5.16 in August 2013 – down from $5.88 in August 2012. Average lease rates for the commercial/retail and office market segments were up on a year-over-year basis.

“Over the last two months we have seen strong year-over-year growth in the amount of space leased through the TorontoMLS system. This growth has been driven by the industrial sector and suggests a strong result for the third quarter. The improvement in leasing activity seems to follow the view that overall economic growth in Canada is expected to improve in the second half of 2013 and even more so in 2014,” said Commercial Division Chair Cynthia Lai.

Combined sales of industrial, commercial/retail and office properties amounted to 48 in August 2013 – down from 65 transactions reported during the same period in 2012. Broken down by market segment, the number of commercial/retail transactions was the same as reported in 2012, whereas the number of industrial and office transactions was down.

Average selling prices, on a per square foot basis for transactions where pricing was disclosed, were up for industrial and commercial/retail transactions and down for office transactions. Year-over-year changes in average selling prices were strongly influenced by changes in the mix of properties sold this year versus last.

“The mix of industrial, commercial/retail and office transactions can change from one year to the next, on the basis of type, use and geography. These changes can result in fluctuations in the average selling price, especially when considering transactions on a monthly basis,” said Ms. Lai.

Untitled-7

GTA REALTORS RELEASE MONTHLY RESALE HOUSING MARKET FIGURES

Greater Toronto Area REALTORS® reported 7,569 residential transactions through the TorontoMLS system in August 2013. This represented a 21 per cent increase compared to 6,249 sales in August 2012.

“Sales were up strongly this past August for all major home types compared to last year. Many households have accounted for the added costs brought on by stricter mortgage lending guidelines and have reactivated their search for a home. These households have found that a diversity of affordable ownership options exist throughout the GTA,” said Toronto Real Estate Board President Dianne Usher.

The average selling price for August 2013 was $503,094 – up by almost 5.5 per cent compared to the average of $477,170 in August 2012. The MLS® Home Price Index (HPI) composite benchmark was up by 3.7 per cent over the same period.

“Despite an increase in borrowing costs during the spring and summer, an average priced home in the GTA has remained affordable for a household earning an average income. With this in mind, tight market conditions are expected to promote continued price growth through the remainder of 2013,” said Jason Mercer, TREB’s Senior Manager of Market Analysis.

Untitled-6

GTA REALTORS Release Mid-Month Resale Figures

Greater Toronto Area REALTORS® reported 3,359 sales through the TorontoMLS system during the first two weeks of August 2013. This result represented a 22 per cent increase compared to 2,743 sales in August 2012.Sales were up on a year-over-year basis for all home types. Total new listings were up over the same period, but by a much lesser rate than sales.

“The strong annual sales growth experienced in July was sustained in the first two weeks of August. The fact that sales were up for all major home types in the City of Toronto and surrounding regions suggests that a wide range of buyers are active in the marketplace today – from first-time buyers through to existing home owners whose housing needs have changed,” said Toronto Real Estate Board President Dianne Usher.

The average selling price during the first two weeks of August 2013 was $494,617 – up three per cent in comparison to the same period in 2012.

“Sales growth that is stronger than new listings growth is indicative of more competition between buyers.Against this backdrop, it makes sense that the average selling price continued to grow,” said Jason Mercer, TREB’s Senior Manager of Market Analysis.

Untitled-8

GTA Commercial REALTORS Report Commercial Market Figures

Toronto Real Estate Board Commercial Division Members reported 681,000 square feet of combined industrial, commercial/retail and office space leased through the TorontoMLS system in July (space leased on a per square foot net basis for which pricing was disclosed). This result, which was driven by the industrial market segment, was 55 per cent higher compared to July 2012.

Year-over-year growth in average lease rates reported on a per square foot net basis was mixed in July. Average industrial and office lease rates were down compared to last year, whereas the average commercial/retail lease rate was up.

“The July leasing numbers were a very good start to the third quarter and it is especially encouraging to see the industrial market segment leading the way. According to the Bank of Canada’s latest Business Outlook Survey, firms are expecting to increase their capital expenditures and employment levels over the next year. In many cases, this should translate into increased demand for space moving forward as well,” said TREB Commercial Division Chair Cynthia Lai.

There were a total of 50 industrial, commercial/retail and office sales reported through the TorontoMLS system in July for which pricing was disclosed. This sales result was down by 12 per cent compared to July 2012. While industrial property sales were down on a year-over-year basis, commercial/retail and office sales were up.

Average selling prices per square foot were down for industrial properties and up substantially for commercial/retail and office properties. Much of the change in average selling prices per square foot was due to changes in the type and location of property sold this past July compared to July 2012.

“A pick-up in leasing transactions moving forward would likely point to an increase in sales in some segments of the commercial real estate market as well. Businesses preferring to own their premises and investors seeking quality long-term returns on investment would be the foundation for this sales growth,” continued Ms. Lai.

Untitled-10

GTA REALTORS RELEASE MONTHLY RESALE HOUSING FIGURES

Greater Toronto Area REALTORS® reported 8,544 residential sales through the TorontoMLS system in July 2013. Total sales were up by 16 per cent compared to July 2012. Over the same period, new listings added to TorontoMLS and active listings at the end of the month were up, but by a substantially smaller rate of increase compared to sales.

“Last month’s sales represented the best July result since 2009 and was the third best July result on record. Despite recent increases in average borrowing costs, home buyers are still finding affordable home ownership options in the GTA,” said Toronto Real Estate Board President Dianne Usher.

“We are a year removed from the onset of stricter mortgage lending guidelines and many households who put their decision to purchase a home on hold have reactivated their search. An increasing number of these households are getting deals done,” continued Ms. Usher.

Reflecting tighter market conditions, the average selling price for July sales was up on a year-over-year basis by eight per cent to $513,246. The low-rise market segment continued to be the driver of overall price growth. It should be noted, however, that the average condominium apartment price was also up by more than the rate of inflation on an annual basis. The MLS® Home Price Index (HPI) was also up on a year-over-year basis for all major home types.

“We are forecasting continued average price growth for the remainder of 2013 and through 2014 as well. Months of inventory for low-rise homes remains near record lows, suggesting that sellers’ market conditions will remain in place in the second half of 2013. An increase in listings in 2014 would lead to more balanced market conditions and a slower pace of price growth next year, albeit still above the rate of inflation,” said Jason Mercer, TREB’s Senior Manager of Market Analysis.

Untitled-9

GTA REALTORS Release Mid-Month Resale Housing Figures

Greater Toronto Area REALTORS® reported 3,603 residential sales through the TorontoMLS system during the first 14 days of July. This result represented a moderate increase of 2.2 per cent compared to the same period in 2012. Over the same time frame, the number of new listings entered into TorontoMLS was down by two per cent.

“The second half of 2013 began with tighter market conditions in the GTA housing market. With sales up and new listings down, it makes sense that the annual rate of price growth accelerated. This was especially the case for single-detached and semi-detached homes in the City of Toronto, which remained in very short supply,” said Toronto Real Estate Board President Dianne Usher.

The average selling price for the first 14 days of July was $510,819 – up by 8.1 per cent compared to $472,632 in the first half of July 2012. The strongest year-over-year increases were experienced in the single-detached and semi-detached market segments in the City of Toronto with growth rates of 10.7 and 14.1 per cent respectively. The condominium apartment segment continued to experience moderate average price growth.

“Expect a faster pace of average price growth in the second half of 2013 compared to the first six months of the year. The strong demand and shortage of listings for low-rise home types in some neighbourhoods will continue to be the driver of price growth. An improvement in conditions in the condominium apartment market will also have a positive impact,” said Jason Mercer, TREB’s Senior Manager of Market Analysis.

Untitled-13

GTA REALTORS Release Rental Market Report

Greater Toronto Area REALTORS® reported 5,853 condominium apartments rented through the TorontoMLS system in the second quarter of 2013. This result was up by approximately 23 per cent in comparison to the second quarter of 2012. The number of condominium apartments listed for rent was up by over 15 per cent to 10,284.

“Condominium apartments rented out by investors have become an increasingly important part of the overall rental stock in the GTA, given that very few purpose-built rental properties have been completed over the last decade,” said Toronto Real Estate Board President Dianne Usher.

“Strong demand for condo rentals has come from households who want to live in up-to-date units but who are not ready to buy. These renter households include would-be first-time buyers who are waiting to save a down payment and/or benefit from increased incomes and new comers to Canada who often choose to rent before entering into the home ownership market,” continued Ms. Usher.

Average rents for one-bedroom and two-bedroom condominium apartments increased well-above the rate of inflation on a year-over-year basis in the second quarter, reaching $1,611 per month and $2,174 per month respectively.

“The fact that annual growth in rental transactions outstripped growth in the number of units listed for rent suggests that conditions in the GTA tightened over the past year and that the vacancy rate has remained very low. Strong competition between renters for available units has prompted continued upward pressure in average rents,” said Jason Mercer, TREB’s Senior Manager of Market Analysis.

Untitled-12